
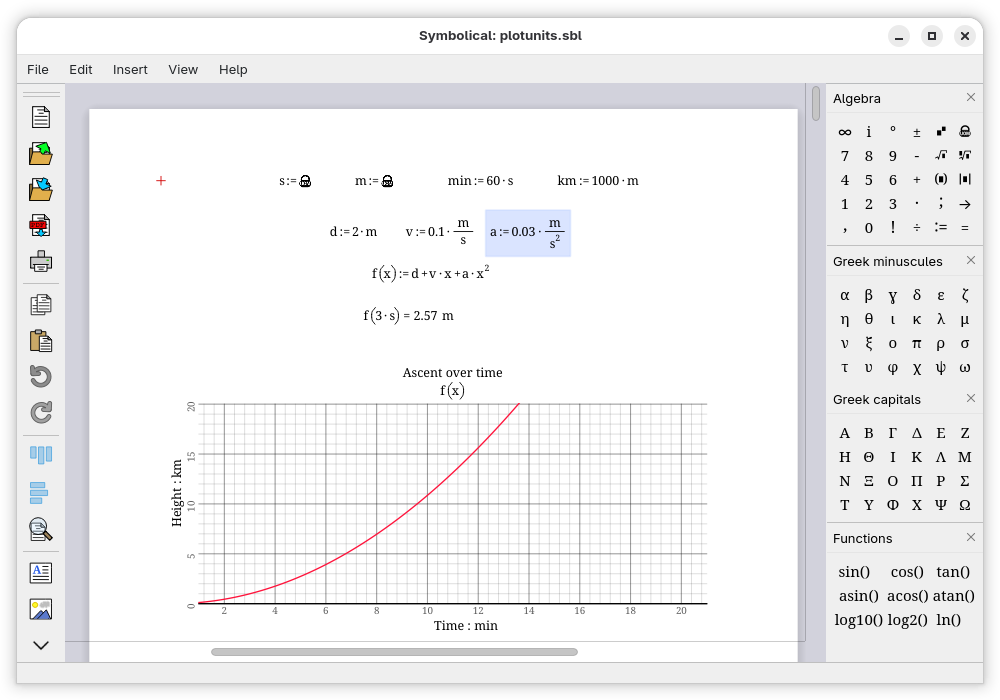
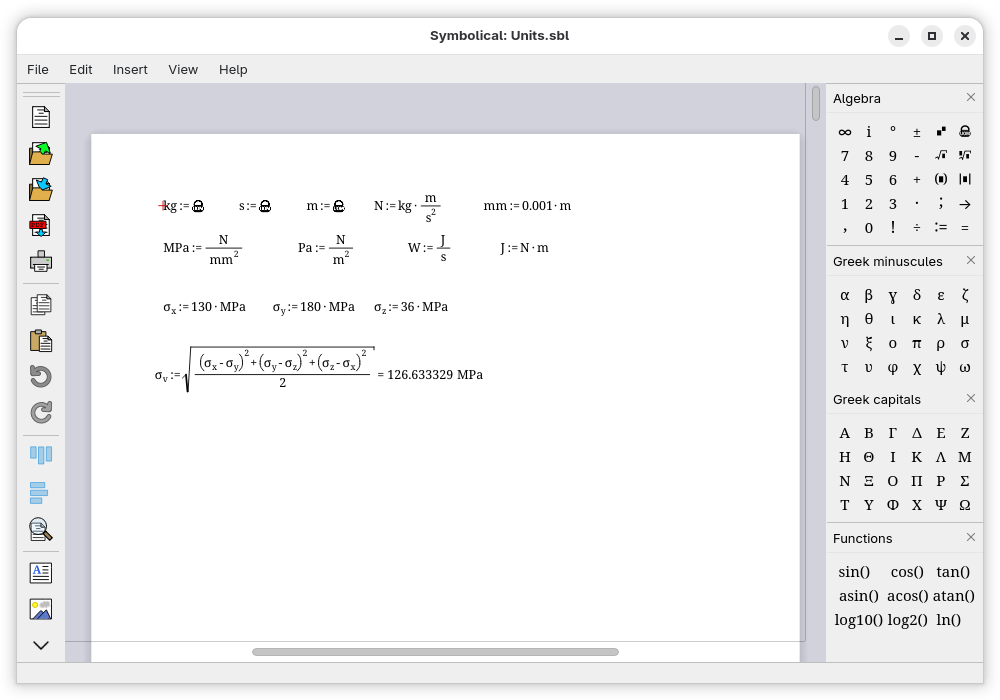
Make math documents with perfectly formatted equations and evaluations. Include text, image and graph fields to document your calculations. The math fields include the ability to make units and functions.
Screenshots
Observed history
| App | Change | Version | When ↓ |
|---|---|---|---|
| updated | 0.8.0.0 | 6 Oct 2026 |
Upstream releases
Release notes supplied by the developer. These dates are not Flathub package publication times.
0.8.0.06 Oct 2026
Trold
Features
- Evaluation and solver engine replaced with SciPy, SymPy and NumPy
- Autocomplete dropdown during editing with information about definit- Negative indices count back from the last element: v[-1] is the one before the last, v[1..-1] goes from 1 to the one before the last, v[-2..] gives the three last elements (the ranges include their bounds); with ORIGIN negative, they stay ordinary positions. They also define elements, as the open ranges: v[-1] := x replaces the element before the last of the previous definition of v, v[2..] := 0 the elements from 2ions
- 2D Map plot
- Calculus solver, view, editing and expressions
- Matrix view, editing and expressions
- SolverBlock for odesolve and find
- Definition overrides with warnings
- Ctrl+G turns the letter before the cursor into a Greek letter (p then Ctrl+G: π); \\ square root, | absolute value, ^ exponent on keyboards where it is not a dead key
- Ctrl+G turns the letter before the cursor into a Greek letter in a text too; a key typed with Ctrl no longer adds an invisible control character to a text
- " typed on the page starts a text, as in Mathcad; the tooltips of the toolbar recall the shortcuts
- Palettes: π, decimal point, matrix product, inverse, determinant, ∞; every tooltip recalls the key of its button
- Translation to Italian, Portugese, German and Spanish
- Added markdown support to Text Field
- Help > Examples: a submenu opening each document of the examples folder, as a copy that is saved elsewhere
- List of the functions (a dock replacing the Functions palette): every built-in function by category, with its usage, a search by name or description; a double click or Enter inserts it at the cursor. Insert > Function... (Ctrl+E) opens it on its search
- readcsv("data.csv"): the numbers of a CSV file as a matrix, the name of the file relative to the folder of the document; the separator (comma, semicolon, tab, spaces) and the decimal comma are found in the file, the titles of the columns skipped; the dates (1980-12-12) are decimal years, the columns of texts are skipped with a warning. A text in quotes is typed with ", the folders and files are suggested while it is typed
- F9 (Calculation > Recalculate) computes every region again with the same random numbers; Ctrl+F9 (Calculation > New Random Numbers) takes the next seed of the document and computes everything again
- The random numbers of a region depend on a key saved with it, no longer on its place: a region moved keeps its numbers and is not computed again; a region pasted draws other ones. The regions of older documents receive the key of their place, and keep their numbers
- time(z): the time in seconds, as in Mathcad, to measure a calculation: t₀ := time(0) before it, time(0) − t₀ after it, z being not used. The regions from the first one that reads the clock are recomputed at each calculation
- An example opened from Help > Examples reads its data files (readcsv) in the examples folder; when the copy is saved, the files a calculation of it reads by a relative name are copied next to it, also when their names are calculated (readcsv(files[k])), a file already there being kept
- Open ranges in the indices, up to the end of the array: M[.., j] is the column j, M[i, ..] the row i, v[k..] the elements from k (typed M[;,j): ; typed in an empty slot puts the cursor after ..
- Negative indices count back from the last element: v[-1] is the one before the last, v[1..-1] goes from 1 to the one before the last, v[-2..] gives the three last elements (the ranges include their bounds); with ORIGIN negative, they stay ordinary positions. They also define elements, as the open ranges: v[-1] := x replaces the element before the last of the previous definition of v, v[2..] := 0 the elements from 2
- last(v): index of the last element of a vector, from ORIGIN, as in Mathcad: v[last(v)] is the last element; a matrix gives an error, its last row is rows(M) - 1 + ORIGIN
- Parametric plots: y(t) against x(t), or y against x, when the abscissa z-transform: ztrans, n, z and invztrans, z, n, which SymPy does not have (from a table of sequences, and by the residues of a rational function)is a function of a parameter (x(t) with t not defined, or the name of a function of one variable); the parameter goes over the interval of odesolve, or over a range set in the settings of the plot (from -10 to 10 by default)
- ones(m, [n]): m×n matrix of ones, square by default, as zeros
- Texts and lists of texts: t := "AAPL", files := ("AAPL.csv", "GILD.csv"); a list holds only texts and is not a vector, a matrix holds only numbers. files[k], length, last, = and ≠, ∈, concat, strlen, num2str; a loop block goes over a list, f ∈ files, and readcsv reads a calculated name, readcsv(files[k]). A text enters no numeric calculation
- cumprod(A, [axis]): cumulative products, as numpy.cumprod, along an axis as cumsum; numbers without units
- argmin(A, [axis = 0|1]) and argmax: the index of the least or greatest element of a vector, from ORIGIN; of a matrix, the column (i, j) of its indices; with axis, an index for each column or row
- Without a previous definition, an open range takes its size from the value: M[.., j] := v creates a matrix of length(v) rows, which a loop block fills column by column
- Plot of a matrix: a curve per column, against the abscissa when the matrix has a row per point, against its indices otherwise; the legend of a column is M[.., j]. Labels of the curves in the settings of the plot: typed for each curve, or a list of texts of the worksheet (fnames), a label typed winning over the list
- Named arguments of the built-in functions: mean(M, axis = 0), with the bold = (typed = after axis in the parentheses, or suggested), the mean of each column (axis 0, a row) or of each row (axis 1, a column); likewise median, sum, min, max, var, Var, stdev, Stdev and cumsum. mean(A, B, …) keeps its meaning
- cumsum(v): cumulative sums of a vector, of the same size and units, as numpy.cumsum; cumsum(M, [axis]) of a matrix down its columns (axis 0, by default) or along its rows (axis 1)
- corr(M): correlation matrix of the columns of a matrix, besides corr(vx, vy) of two vectors
- cov and Cov: covariance of two vectors, or covariance matrix of the columns of a matrix, of a population (cov, as var) or of a sample (Cov, as Var and numpy.cov)
- Roots and fractional powers of a square matrix: √A, ⁿ√A and sqrt(A) are the matrix whose n-th power is A, so that (√A)² = A, and A^p is computed for any real p (scipy.linalg.fractional_matrix_power); a matrix without root ([[0, 1], [0, 0]]) gives an error
- Loop blocks (Insert > Insert Loop Block): a frame whose regions are computed at each iteration. i ∈ v (Ctrl+Shift+E), the first region, gives the loop variable; a relation is a condition to go on (while at the top, do... while at the end); x := x + h reads the value of the previous iteration, T[k] := x keeps a history. The names defined in the block are visible after it, with their last values; an error stops the loop and says where (At i = 37: ...); a loop without a loop variable stops in error after 100000 iterations (Loop Settings...). A variable of a single value, j ∈ 1, and a condition at the top make an if, a name defined before the block being the else. (a ∈ v) = is 1 when a is an element of v
- Function blocks (Insert > Insert Function Block): a function whose body is several regions, the signature S(x, n) first, then local definitions and loop blocks nested to any depth, the value returned last. The function is called, plotted, integrated or vectorized as any function; the local definitions are not visible after the block; an error in a call is reported on the region that calls, with where it occurred (In S: At i = 2, k = 3: ...)
- Nested blocks: loop blocks and solve blocks nest in loop blocks and function blocks, to any depth: nested loops, an if in a loop, a solve block in a loop to sweep a parameter. An error gives the iterations of all the loops (At i = 2, k = 1: ...)
- Symbolic integral transforms: f(t) → fourier, t, ν gives ∫ f(t)·e^(−2πi·ν·t) dt, invfourier, ν, t its inverse; laplace, t, s and invlaplace, s, t (the function for t ≥ 0). The Dirac delta of the results is displayed δ
- Bar charts: in the settings of a plot, each curve is drawn as a line or as vertical bars, the two mixed in a plot. The bars stand on 0 (on the bottom of a logarithmic axis), the bars of several curves side by side at each abscissa, the curves over them; the axes fitted to the curves show the bars whole
- Polar plots: Insert > Insert Polar Plot, Polar Coordinates in the menu of a plot, or Coordinates in its settings. Each curve gives the radius against the angle θ, from 0 to 360 deg by default, graduated in degrees or in fractions of π; a negative radius passes to the other side of the center; the radius fitted to the curves, zoomed with the wheel
- Curve fitting: linfit(vx, vy, F), a linear combination of functions, genfit(vx, vy, vg, F), a function of parameters, and regress(vx, vy, k), a polynomial for interp; the function F is given by its name. Histograms: hist and histogram. Sorting and searching: csort, rsort, match and lookup, also in lists of texts. gcd and lcm
- writecsv("data.csv", M, [titles]): the numbers of a matrix in a CSV file of the folder of the document, the titles of its columns first; a region writecsv(…) is computed without =, and the file is written out of the editing of the regions
- readexcel("data.xlsx", [sheet or range]) and writeexcel("data.xlsx", M, [titles]): Excel workbooks, read as CSV files and written as writecsv does (openpyxl)
- z-transform: ztrans, n, z and invztrans, z, n, which SymPy does not have (from a table of sequences, and by the residues of a rational function)
- Boundary value problems: odesolve solves differential equations whose conditions are at two points, y(0) = 0 and y(L) = 0 (scipy.integrate.solve_bvp); a condition can mix the values at the two ends, y′(L) + k·y(L) = 0, and a function defined before odesolve, y(x) := …, is the initial guess of the solution
- Partial differential equations: u := pdesolve(u, x, (a, b), t, (t₀, t₁), [xpts], [tpts]) in a solve block, as in Mathcad Prime, by the method of lines; the partial derivatives are written u.t(x, t), u.xx(x, t) (subscripts) or with d/dt and d/dx; equations of the first or second order in t, up to the second in x, initial conditions u(x, t₀) = f(x), boundary conditions u(0, t) = g(t), u.x(L, t) = 0 or any equation between them; systems (u, v) := pdesolve((u, v), …); the solution u(x, t) is plotted as curves or as a map
- Cut (Edit > Cut, Ctrl+X, the toolbar and the menu of a selected region): the selected regions go to the clipboard and are deleted, in one step that Undo restores
- Functions with multiple paramaters are now allowed
- TextField wysiwyg and Markdown editor
changed
- The toolbar of the text fields (bold, italic, headings, alignment, lists) floats just above the text field being edited, under it when there is no room above; it follows the field when the page scrolls or is zoomed, and is hidden while the field is out of the view
- The formulas are typeset as TeX does, with Latin Modern Math (fonts/latinmodern-math.otf, GUST Font License): fractions, scripts, radicals, large operators and stretchy delimiters placed with the constants and the variants of its MATH table, the spaces of TeX between atoms, fractions in a fraction smaller as in LaTeX. Variables are in italic; numbers, units and the names of functions in Noto Serif, the font of the text, the formulas having the x-height of the text (13.7 pt for 11 pt). A product a·b is drawn a b with a thin space when it cannot be misread (E I, x² sin(x)), its dot shown while it is edited. Results are on one line of TeX with their formula. The previous drawing is kept for comparison with SYMBOLICAL_TEX=0; tools/tex_compare compares the formulas with LuaLaTeX
- A loop block without a loop variable whose conditions read no name it defines is an if: one iteration when they hold, none otherwise, with the header If, condition true or condition false; it needs no j ∈ 1 any more, and no longer stops in error after the maximum number of iterations
- The product and the power are strictly matrix: v·v of two vectors and v² of a vector are errors, whose message says to write vᵀ·v for the dot product, or to vectorize →(v·v), →(v²) for the computation element by element (v·v gave the dot product, as in Mathcad, but a NumPy user expects the product element by element). The roots √v, ⁿ√v, sqrt(v) and the power of a non-square matrix are errors as well, with the same advice
- The order of calculations is now incrementing on page position of fields like MathCAD.
- odesolve: explicit equations, y′(t) = expression, are evaluated once per step instead of being solved as linear in the highest derivatives; the Lorenz attractor example is computed 4 times faster
Fixes
- Catch exceptions on save action
- A plot alone is copied, and pasted again: it was not put in the clipboard, and a plot copied with other regions was not created when pasted
- Backspace or Delete in the empty operand of an operator of the whole formula deletes the operator, as for :=: x, Home, + then Delete gave ▪ + x again, x + then Backspace x + ▪
- The arguments of a function whose name has a subscript are drawn after the subscript: V.box(a, h) was drawn over it
- Printing more than two pages results in blank pages.
- A .sbl file renamed outside Symbolical is saved under its new name: it was written again under the name stored inside it
- The curves of a plot are kept until what they read changes: they were computed again after each key typed anywhere in the document
- A letter or a digit typed after the parentheses of a function call is no longer added to its name: cos(t) then x gave cosx(t), as after any other expression nothing is typed there
- The empty side of a relation is deleted with its = as for a definition: x = t + 1 typed with Ctrl+=, the name erased, backspace leaves t + 1, to type := instead; the = stayed whatever the keys
0.7.0.026 Sept 2026
Spire
Features
- Predefined units and constants view implement.
- Page size dropdown implemented in document settings
- Templates added
- Template widget on new document
- Integration with OS templates
Fixes
- Update page view layout after page size is changed
- Don't accept the python j composant of complex numbers as input
- Fixed font for Flatpak and Windows
- Fixed correct paper size when printing
- Fixed zoom fit to handle "next page"
- Fixed zoom fit to view ahead of the cursor
0.6.8.011 Sept 2026
Rod
Features
- Open latest documents
- visualized margins
- Page size implemented
- Move fields from page to other page
- Only draw visible pages
- Converted from python-dbus to QtDBus
0.6.5.121 Aug 2026
Yngling
Features
- Highlight expression fields with errors
- Added support for complex numbers throughout
- Added document info and meta data
Bug fixes
- Missing parenthesis on case with adding expression to addition and subtraction expression