Detect audio mastering defects. Based on pymasvis app/module, using numpy, scipy, pyplot (matplotlib).
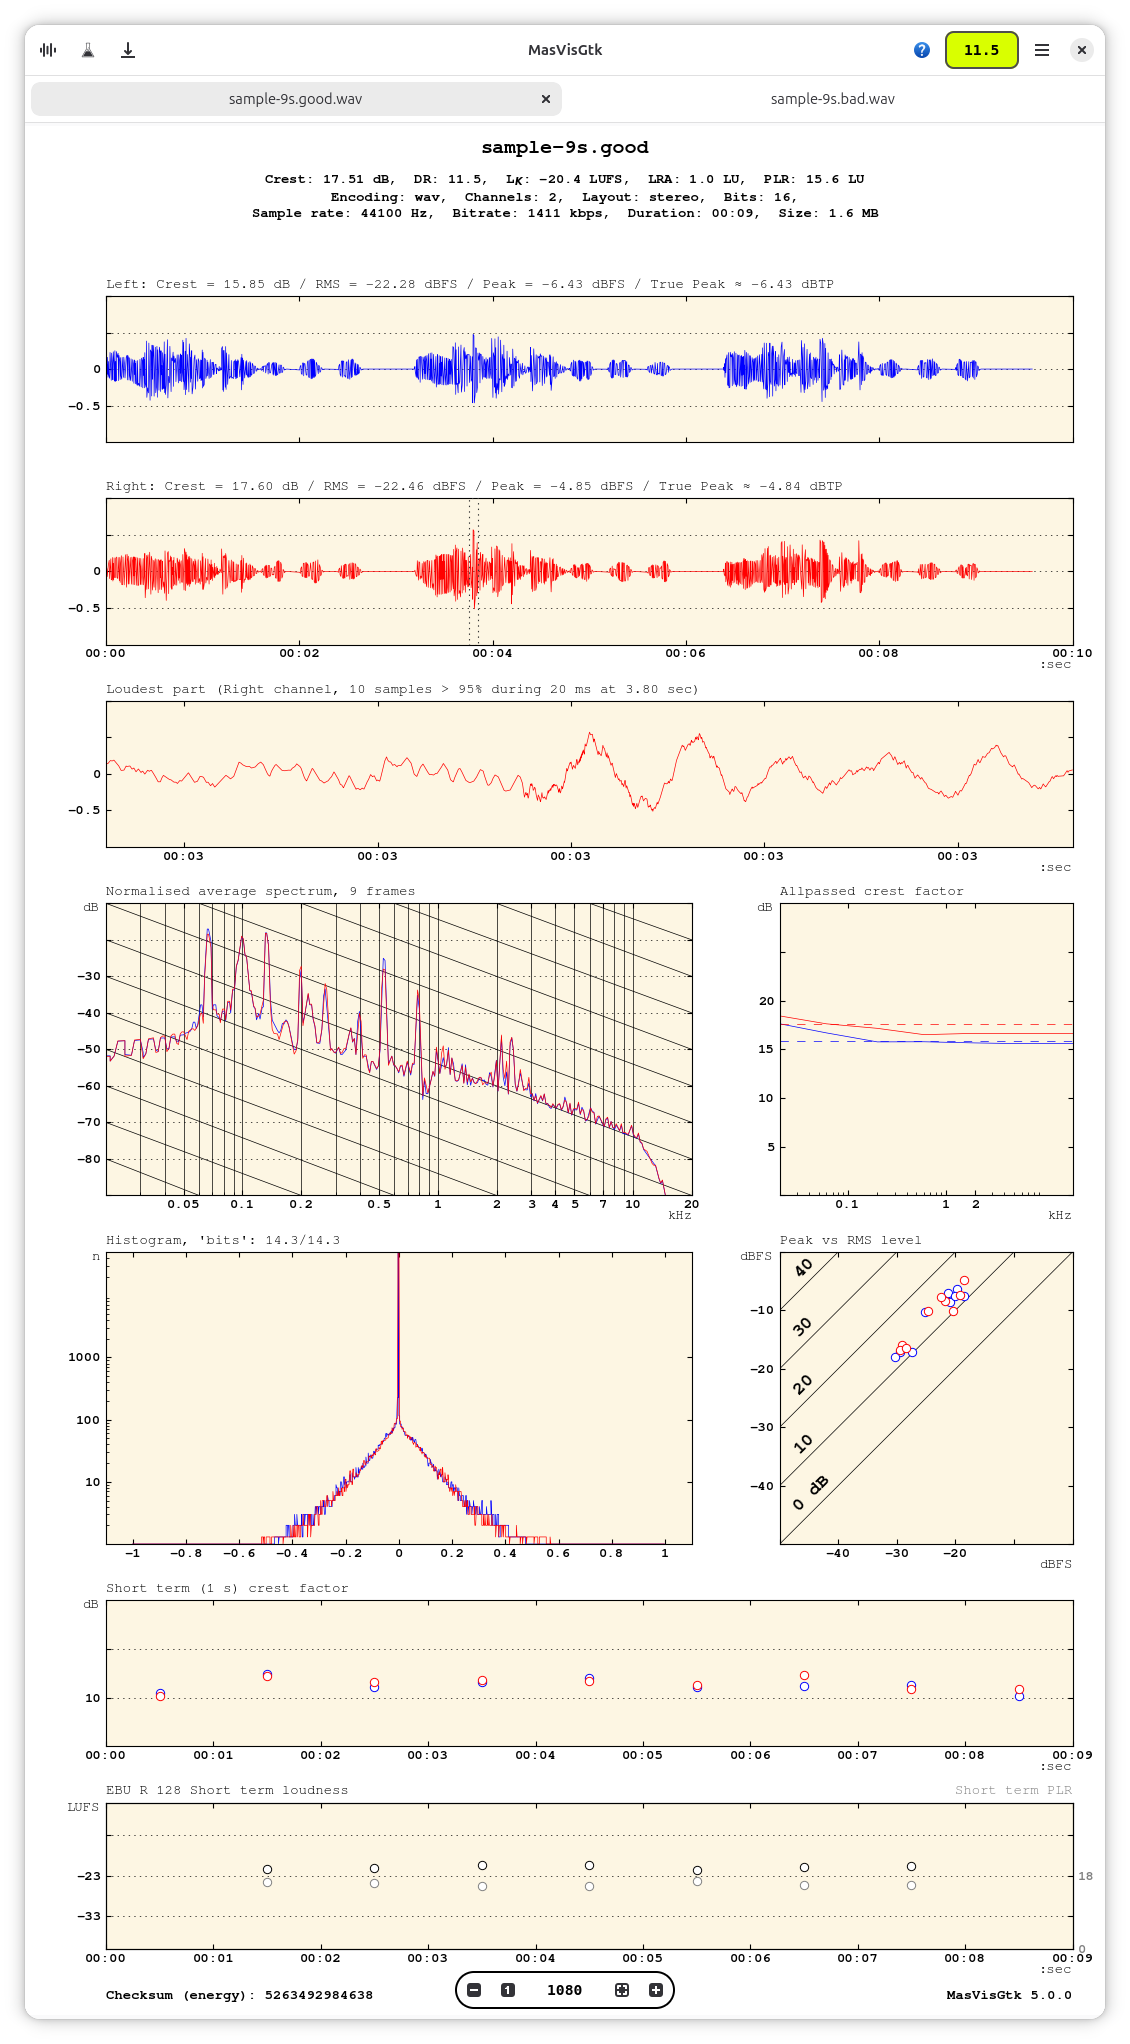
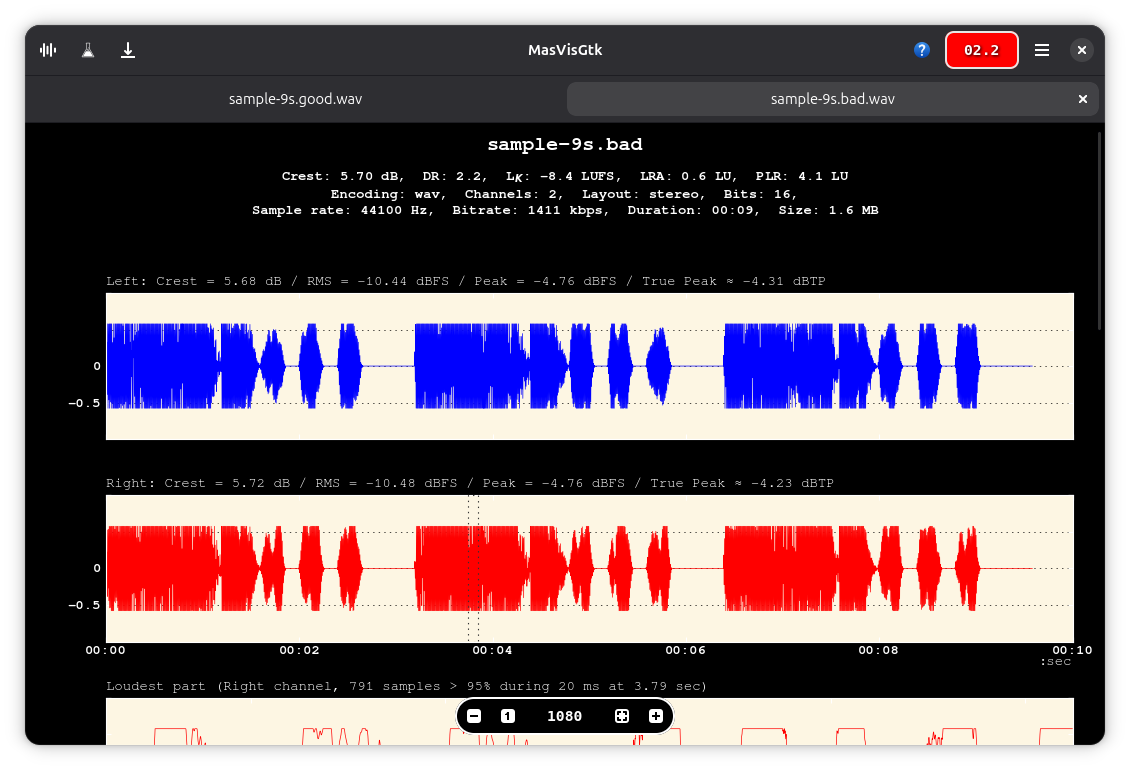
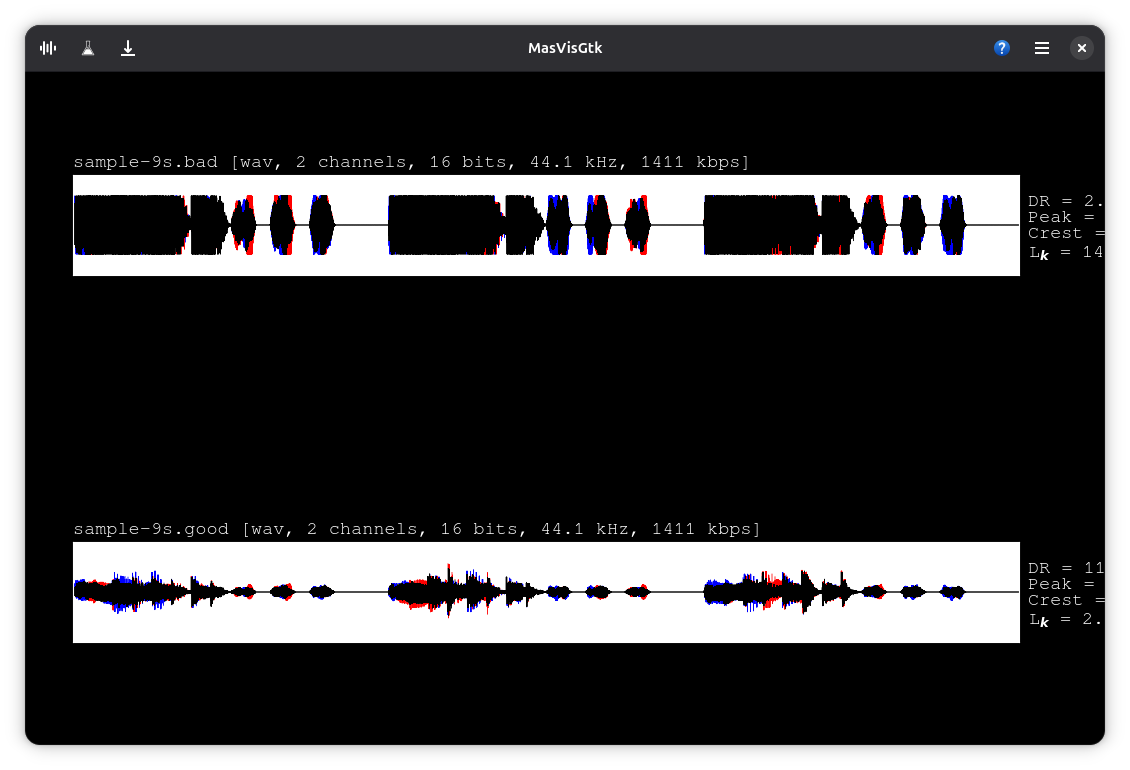
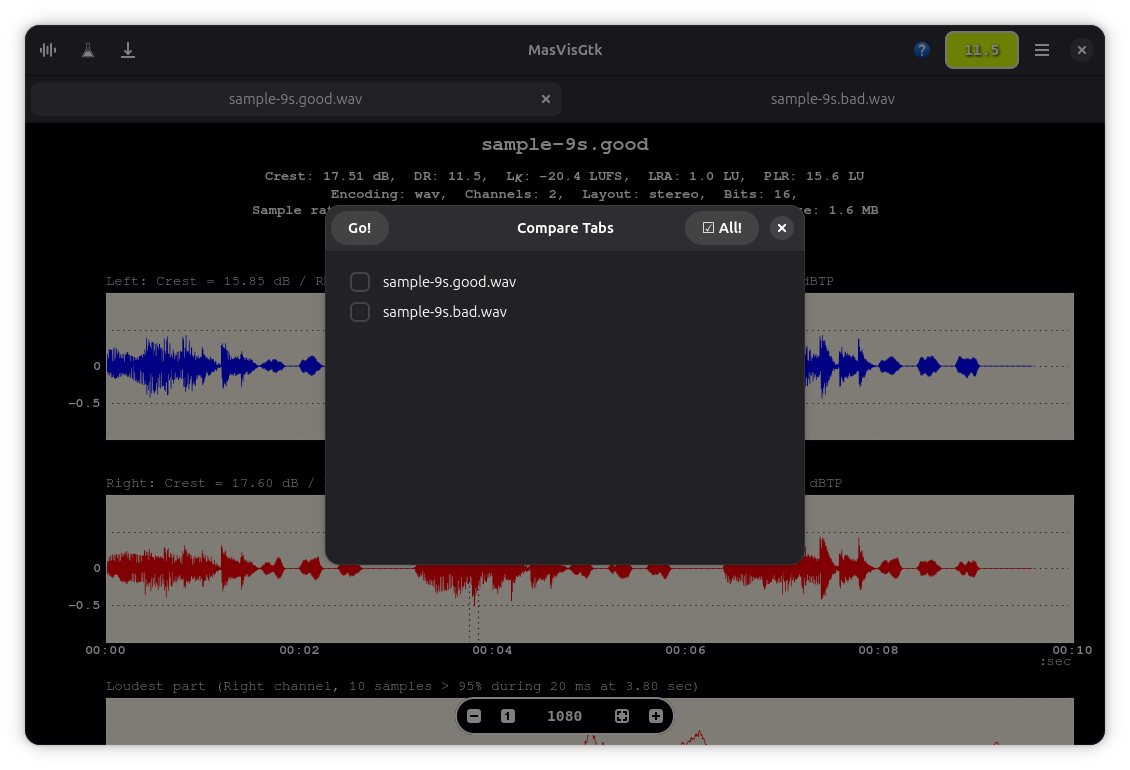
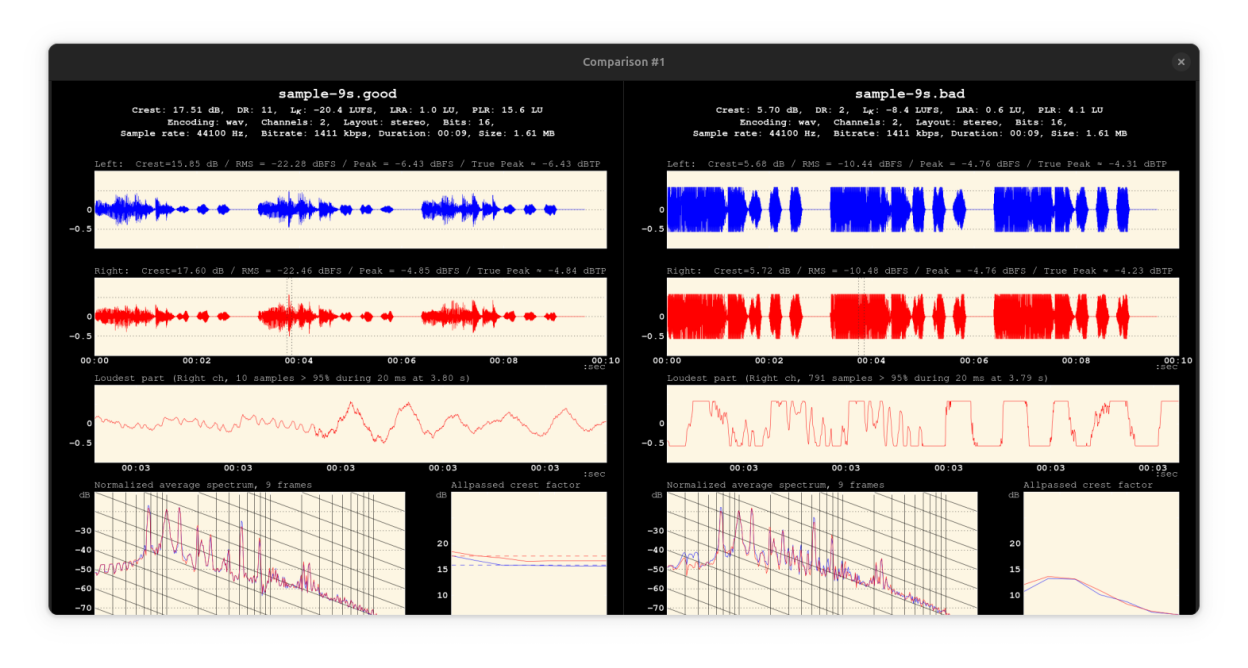
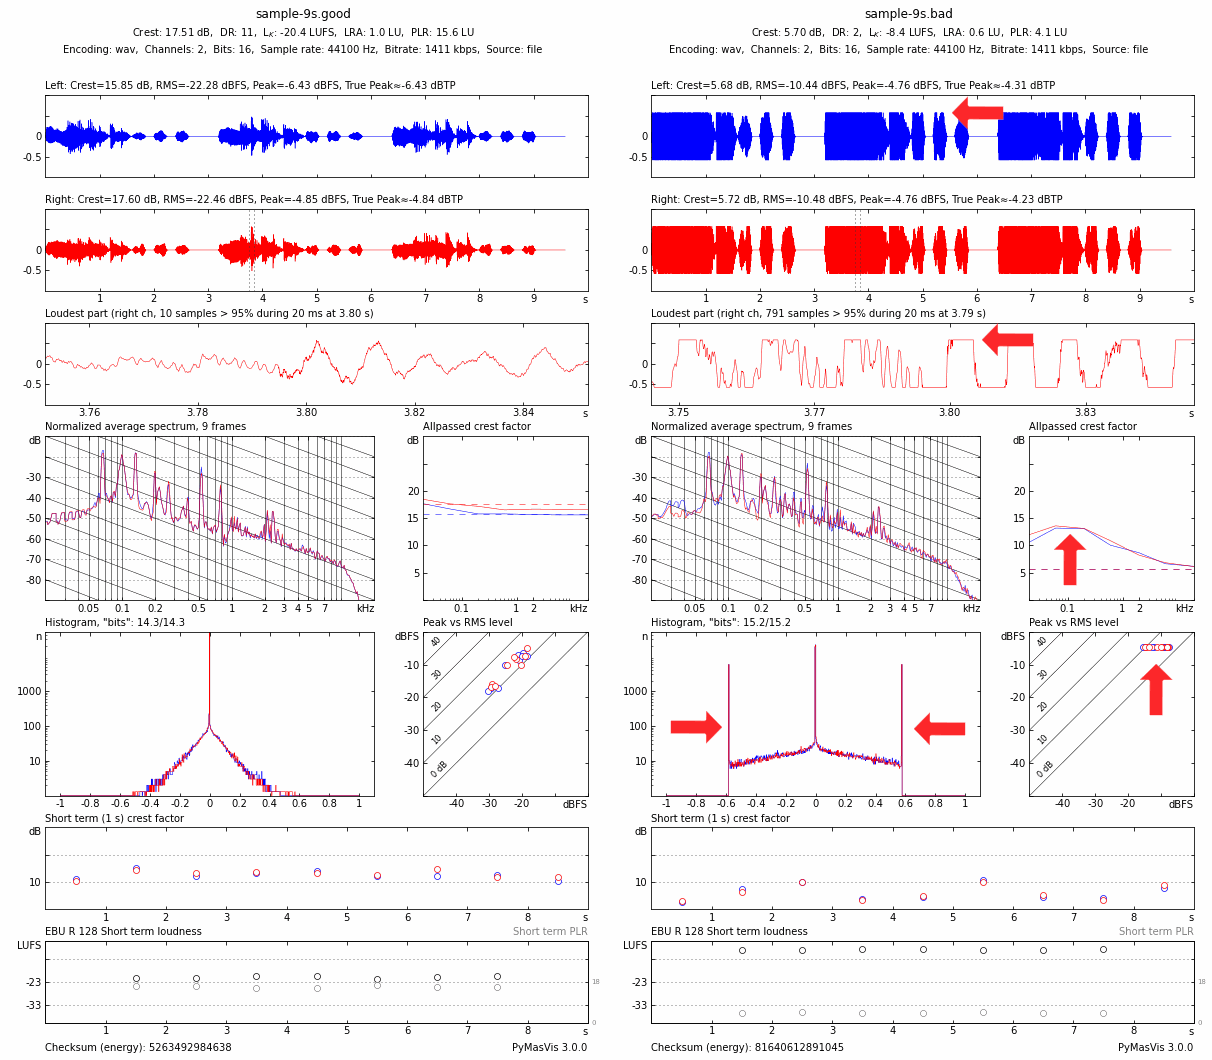
- Waveform plotting
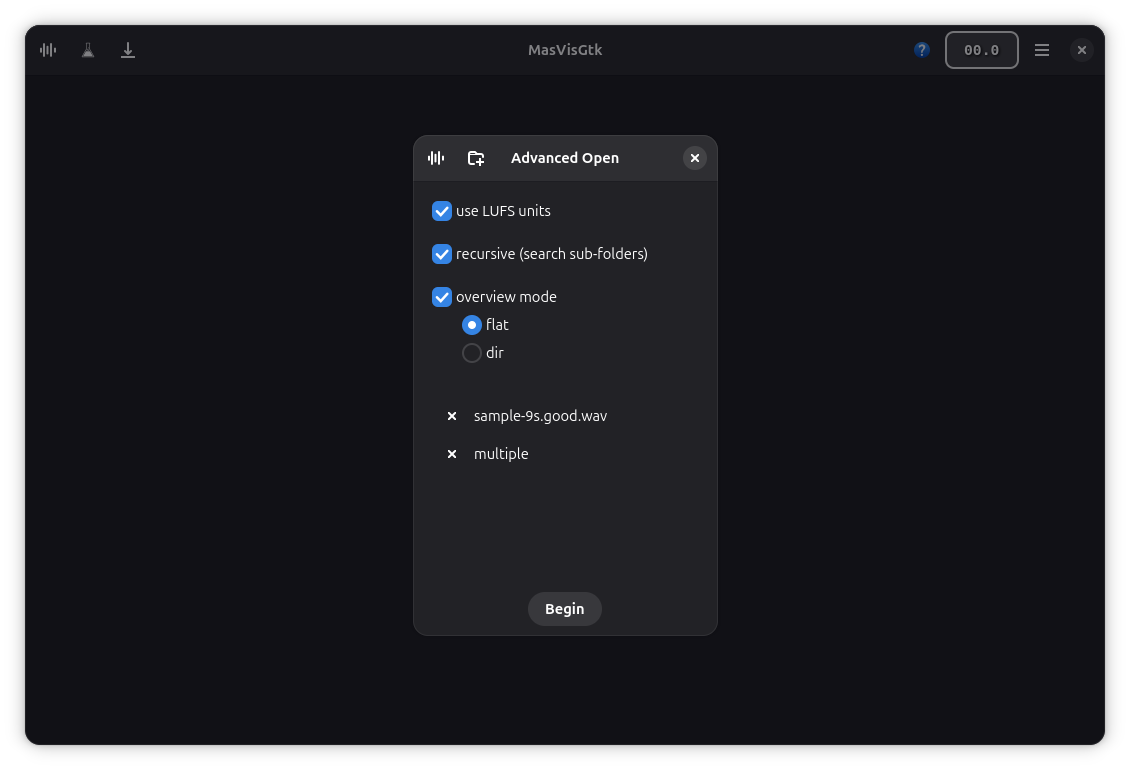
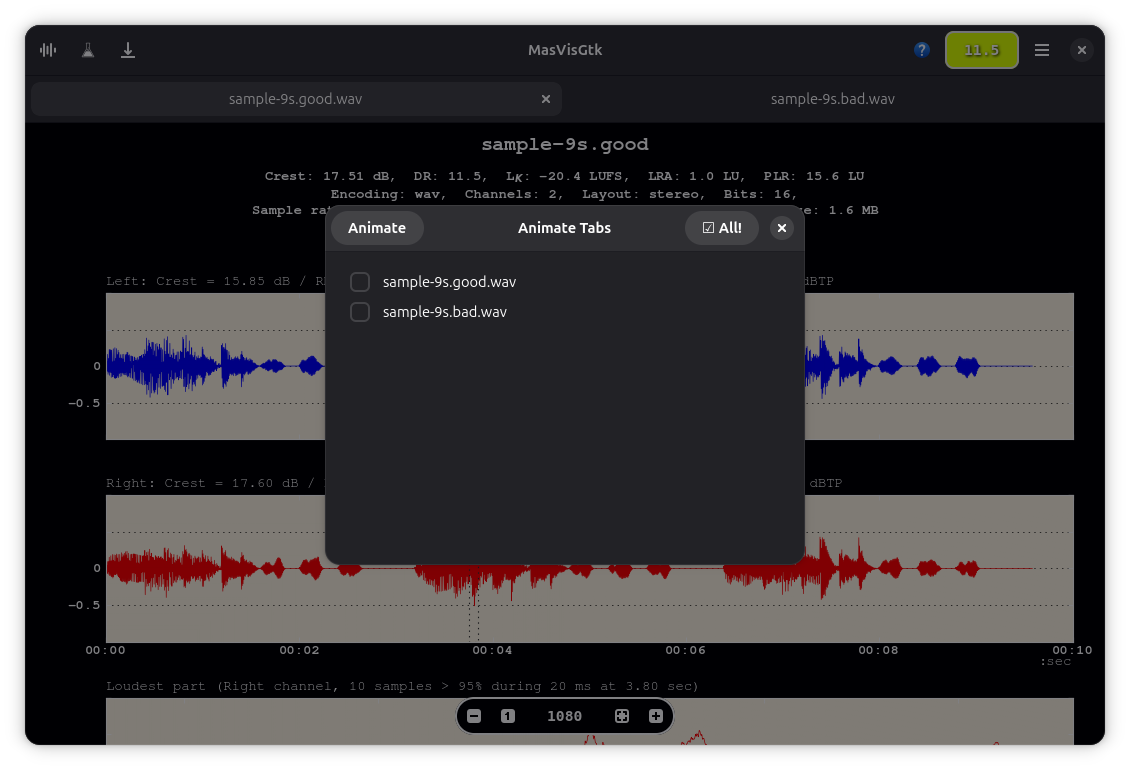
- Overview of files (by-folder support)
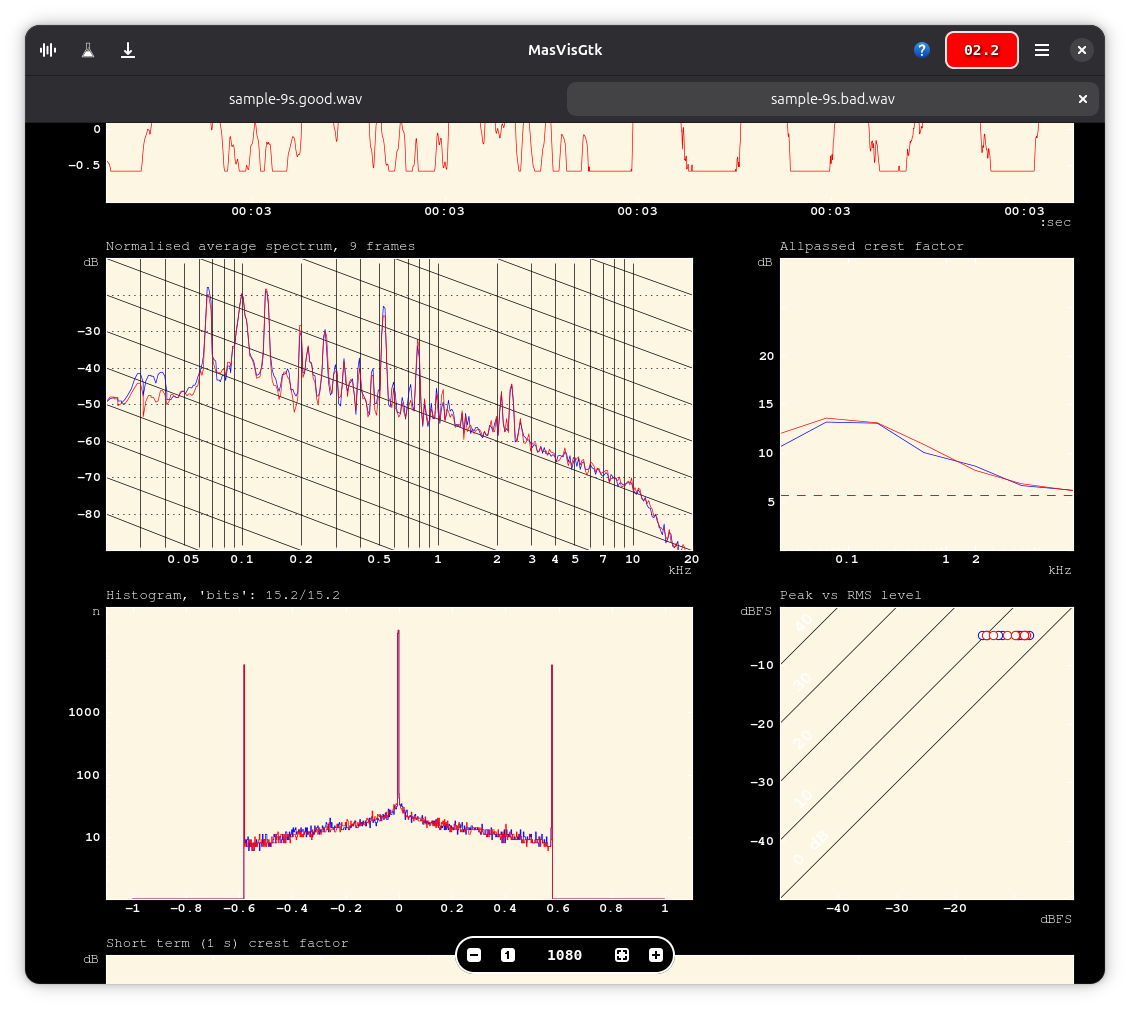
- Frequency plot
- Dynamic Range estimation
- Peak estimation
- Crest Factor estimation
- Histogram plot
- Peak vs. RMS plot
- Loudness analysis, EBU R128 plot
- Multi-channel audio support
Screenshots
Observed history
| App | Change | Version | When ↓ |
|---|
No observed changes yet.
The initial import establishes a baseline. Future version changes will appear here.
Browse the app catalogue →Upstream releases
Release notes supplied by the developer. These dates are not Flathub package publication times.
6.1.011 Jul 2026
Updated matplotlib to v3.11.0, numpy to v2.5.1, scipy to v1.18.0, pybind11 3.0.4, pythran-0.18.1.
Added libraqm and harfbuzz (as system) for matplotlib, with changed build parameters.
Fixed width bug.
Suppressed findfont messages.
6.0.21 Apr 2026
Updated Russian translation.
Fixed Dynamic Range label bug.
Fixed Adw.TabPage tooltip un-escaped text.
6.0.111 Oct 2025
Added Russian translation.
Updated translations.
6.0.06 Oct 2025
Support for processing with GStreamer (if user-enabled).
Error dialog now has Gtk.Widget that can copy text.