
AlphaPlot
AlphaPlot is a free application for Scientific Data Analysis and Visualization
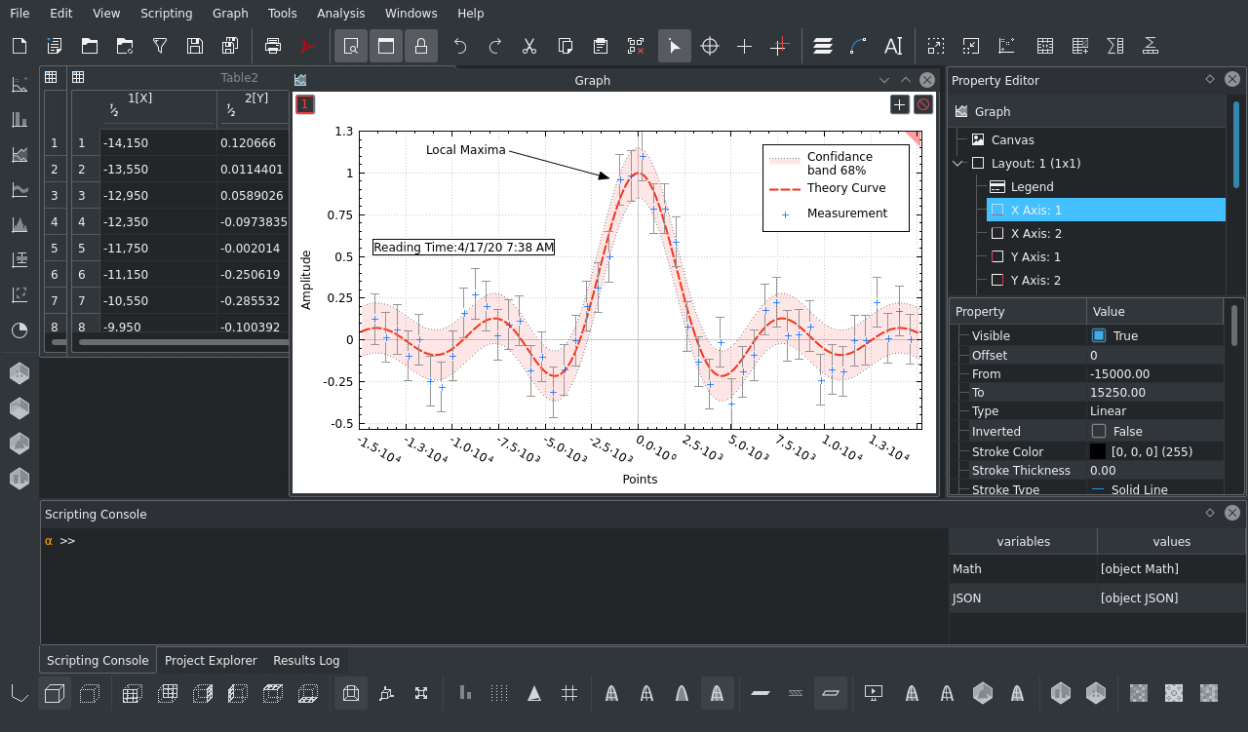
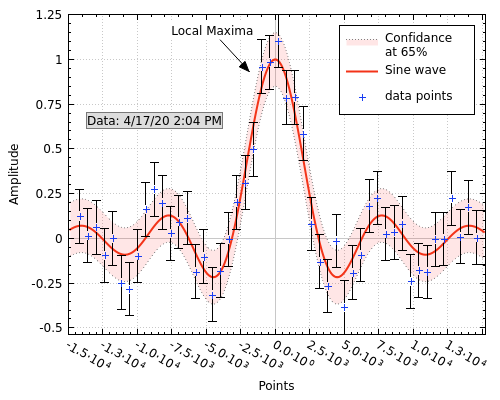
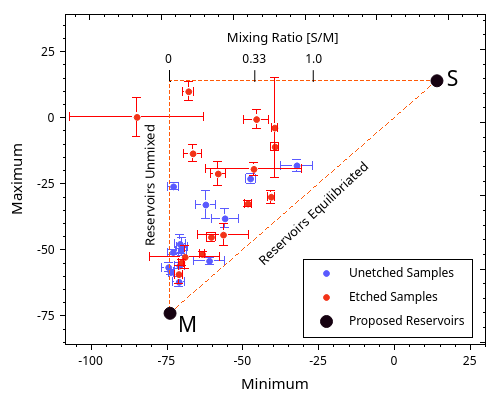
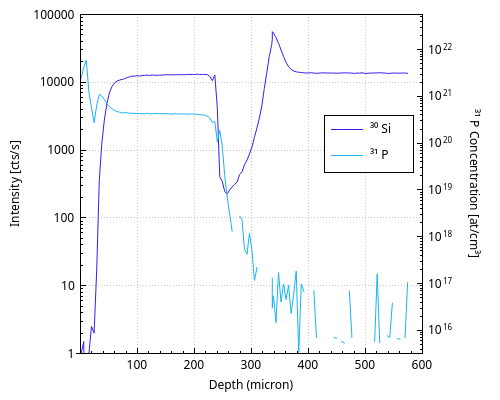
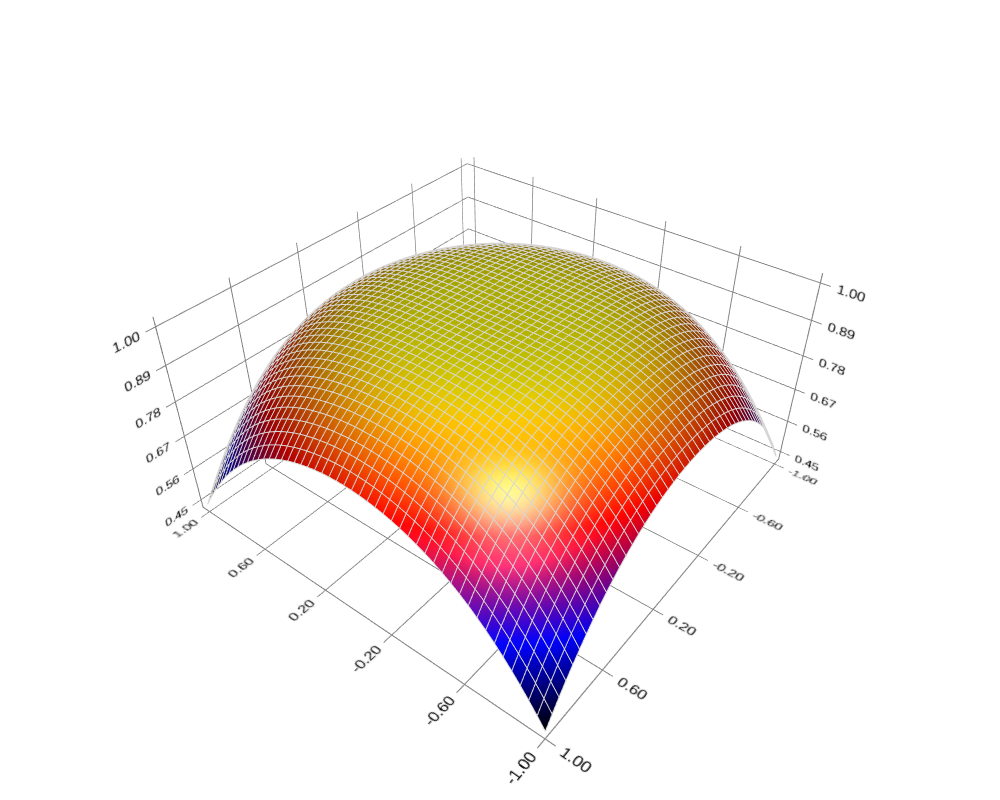
io.github.narunlifescience.AlphaPlotAlphaPlot is an open-source computer program for interactive scientific graphing and data analysis. It can generate different types of 2D and 3D plots (such as line, scatter, bar, pie, and surface plots) from data that is either imported from ASCII files, entered by hand, or using formulas.
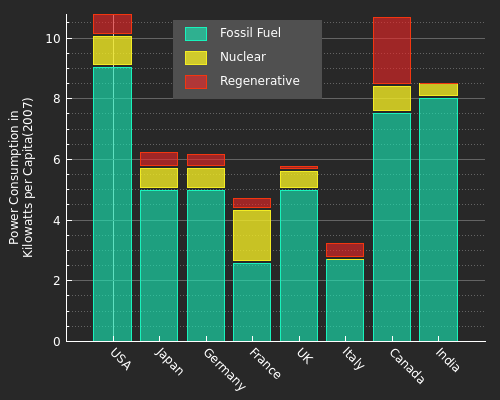
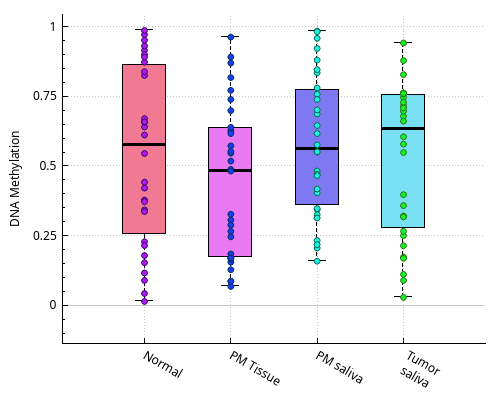
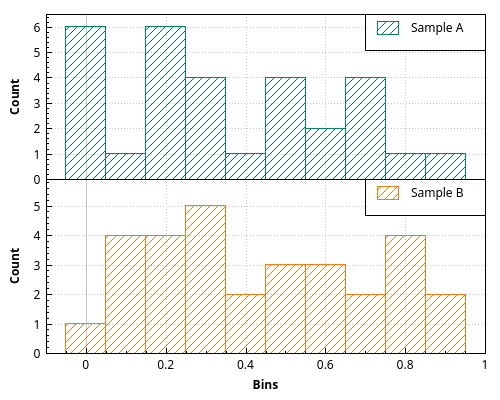
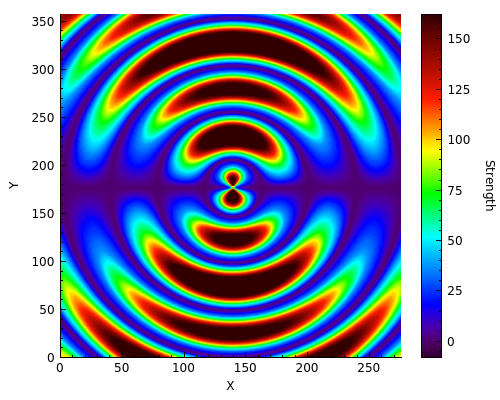
Screenshots
Observed history
| App | Change | Version | When ↓ |
|---|
No observed changes yet.
The initial import establishes a baseline. Future version changes will appear here.
Browse the app catalogue →Upstream releases
Release notes supplied by the developer. These dates are not Flathub package publication times.
1.0218 Jan 2022
Overview of changes in AlphaPlot 1.02
- project explorer drag n drop
- add 2D legend visibility per plot, legend margins and legend direction property
- fixed multiple crash issues thus increasing the stability
- go to data column from property editor graph2d
- selected mdi subwindow glow indication
- fix vector plot related orientation issue and antialiasing issue
- add layout element swap functionality
- add the ability to customize brush patterns on all graph typefills, text item fill and layout element fills
- xml file based new update checking
- Template saving and loading (for matrix, table, plot2d, plot3d)
- grouped bar charts (vertical and horizontal)
- rewrite the layout system to a grid type one (with row and column stretch factor adjustment)
- add title element to legend
- remove Zlib dependency and use Qt equivalent
- add margin adjustment for layout elements
- add Polynomial, Cubic Periodic, Akima Periodic, and Steffen Interpolation
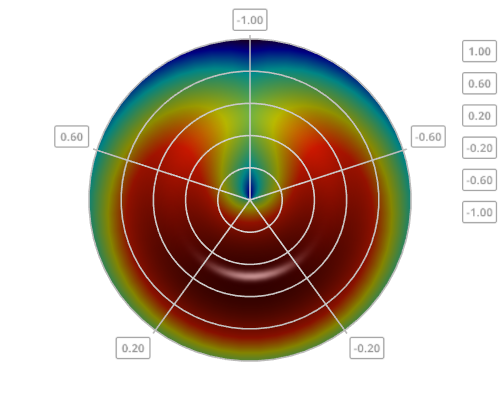
- add 3D polar plot options and a 2D polar spectrogram with camera position on top
- 2D axis from to precision setting based on axis tick precision
- add symbol/glyph browser
- new settings dialog
- duplicate plot2D and plot3D windows
- swap plot2D layouts
- optional legend title
- center plot on print plot2D
- clone plot2D and Plot3D
- save plot3D
- print plot3D
- upgrade qcustomplot library to 2.1.0
- improve plot3D mouse interactions
- subwindow creation time load/save fixed
- show function details on property browser function plot item
- make property browser plo2D items dynamically change icons based on plot property change
- save/load grouped bars plot2D
- enable move picker on plot2D
- make image item resizable and rotatable plot2D
- use Axis2D label as object browser item name
- fix function plot line unable to set properties (color, style)
- fix print with transparent background issue (Plot 2D)
- implement change order of plots-names in legend
- fix object browser context menu request reflect property browser update
- add multiple data checks for adding plots and additional controls
- add more customization of symbol, value, date, datetime, log, text axis 2d
- column type lock feature to prevent users form changing it while use in a plot2d or plot3d
1.01.16 May 2020
Overview of changes in AlphaPlot 1.011
- multipeak fitting fixed
- ditch QwtPlot3D for qdatavis3d
- reimplement all the graphs except trajectory in qdatavis3d
- integrate customization to property editor
- separate data manager class to handle inputs to the graph
- XML save part incomplete
- add the ability to customize Axis2D line endings
- fix some issues with legend move updating in property editor and ability to break individual legend text
- pie charts take 2 columns X as label and Y as values
1.0117 Apr 2020
Overview of changes in AlphaPlot 1.01
- Completed porting to QT5
- Replace QWorkSpace with QMDIarea as a step towards Qt5
- Add more random number generators with specific distribution profiles (Gaussian, exponential, etc.)
- Drop Qt3 Support and rewrite project explorer to Qt5 standards
- Added a function to show column data spikiness to get an idea about general data
- color code X, Y, Z, Xerr, Yerr and none column types with a line under them for easy identification
- add some utilities like detection of OS and its kind, Random color generation based on the golden ratio, etc
- use a QDialog wit much more information to show mdiwindow properties
- add a declared variable view list for QtScript scripting console-like Matlab
- use xml to store AlphaPlot files for better structuring and handling
- added a property editor to browse property of all QMdiWidgetItems (2dplot, 3dplot, table, matrix, note)
- introduce QCustomplot to replace the aging qwt4 library
- use a separate data handler class for 2D plots
- add a basic layout management system like a queue
- draggable legend, graph items (line, text), axis, zoom axis
- reimplement all the 2D plotting functionality in qcustomplot
- reimplement all the fitting functionality in qcustomplot