
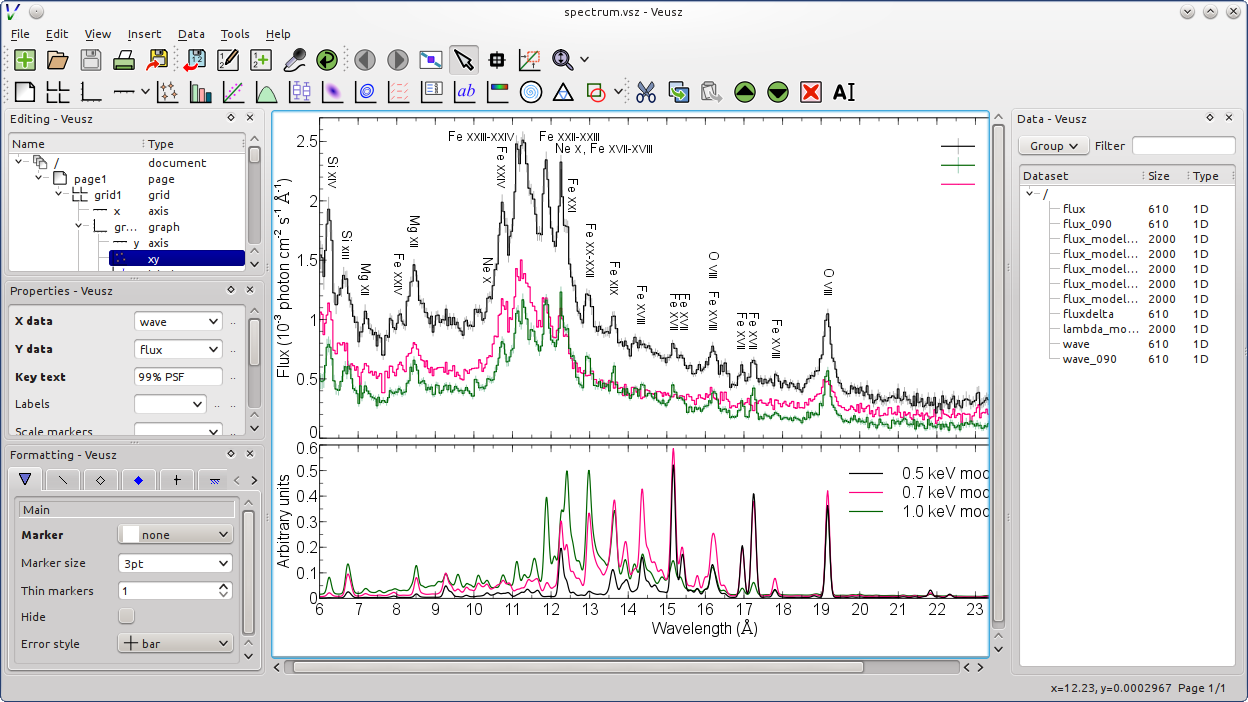
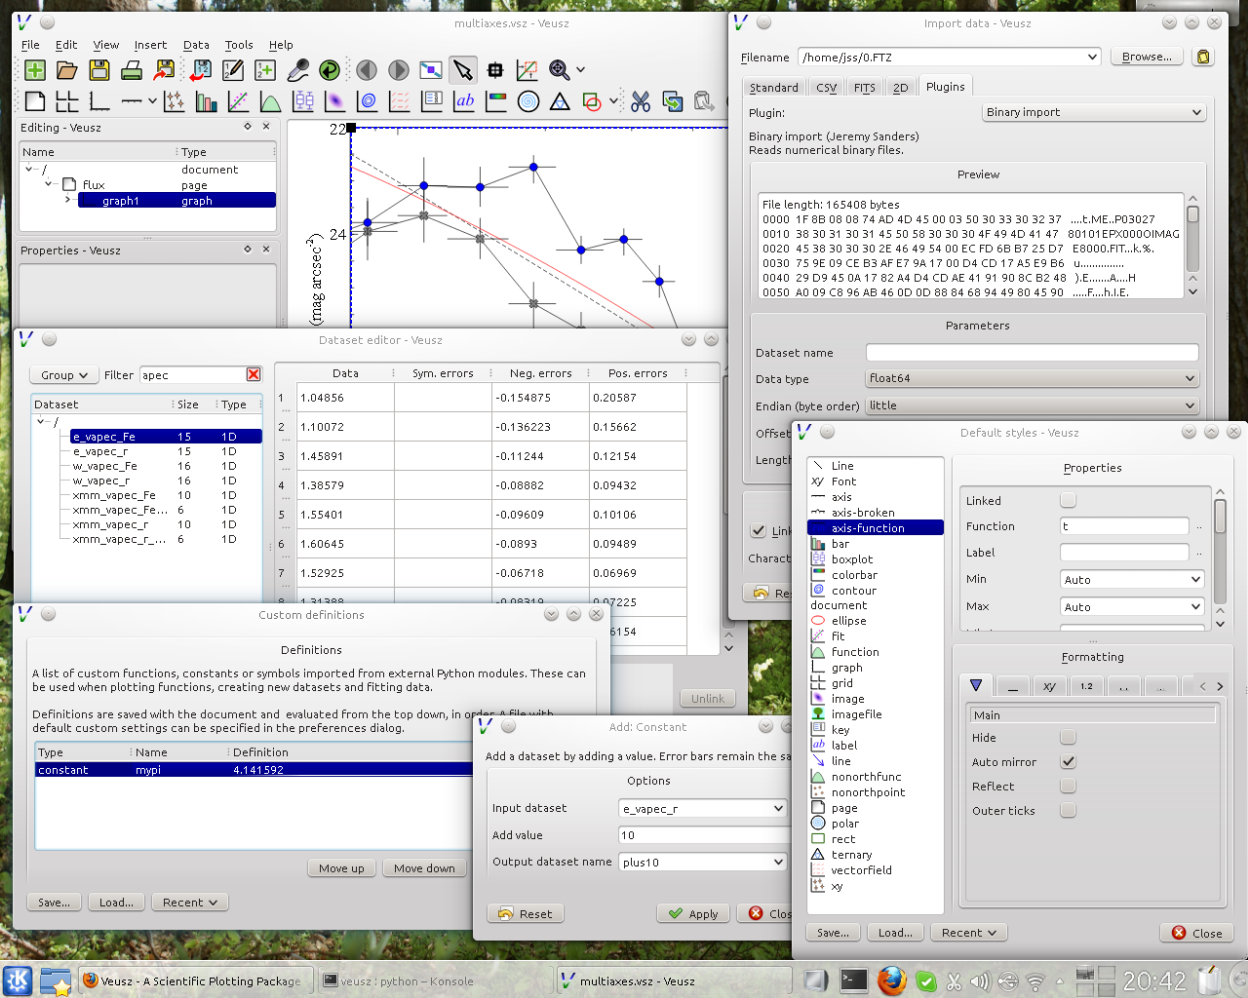
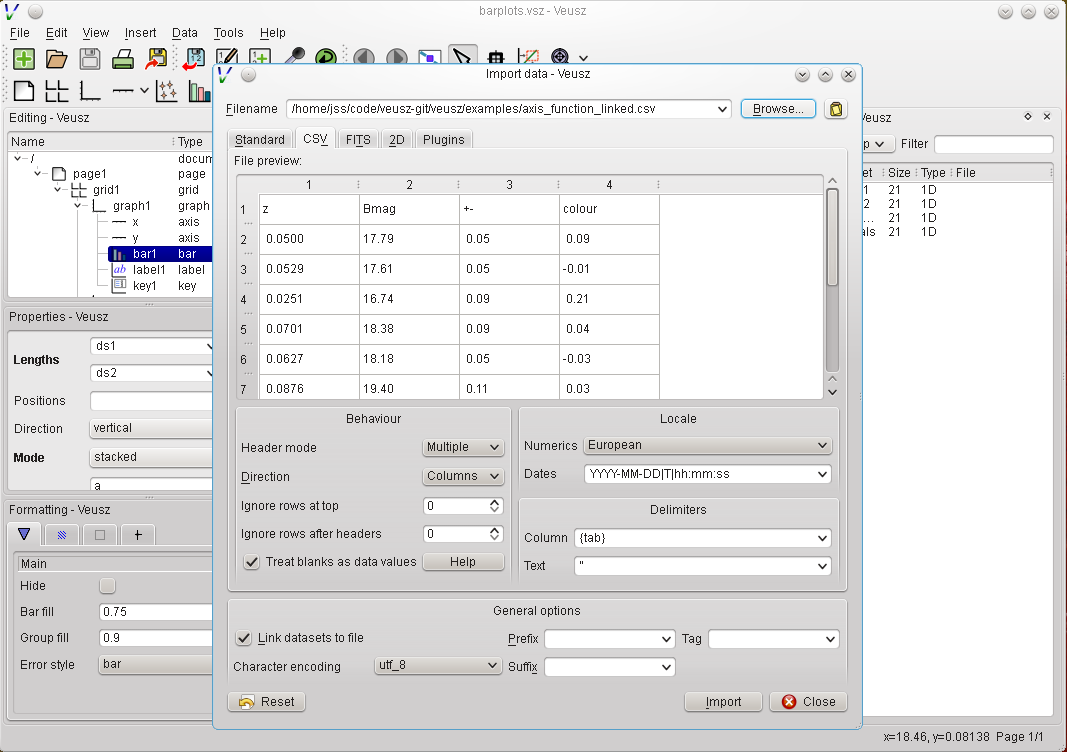
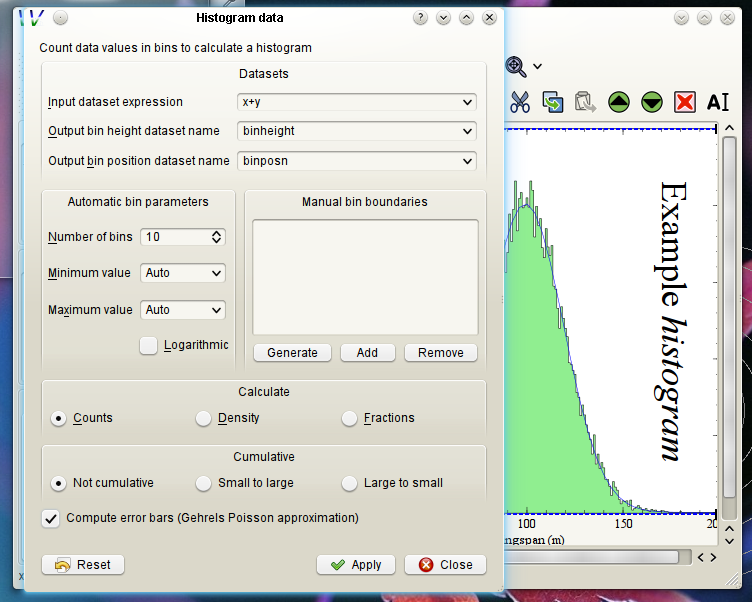
Veusz is an interactive graphical scientific plotting and graphing package. It is designed to produce publication-ready PDF output. SVG, EMF and bitmap export formats are also supported. Data can be read from text, CSV, HDF5 or FITS files. In addition, you can also enter, manipulate or examine data from within the application. The program also provides a command line and scripting interface (based on Python) to its plotting facilities. It can also act as a Python plotting module.
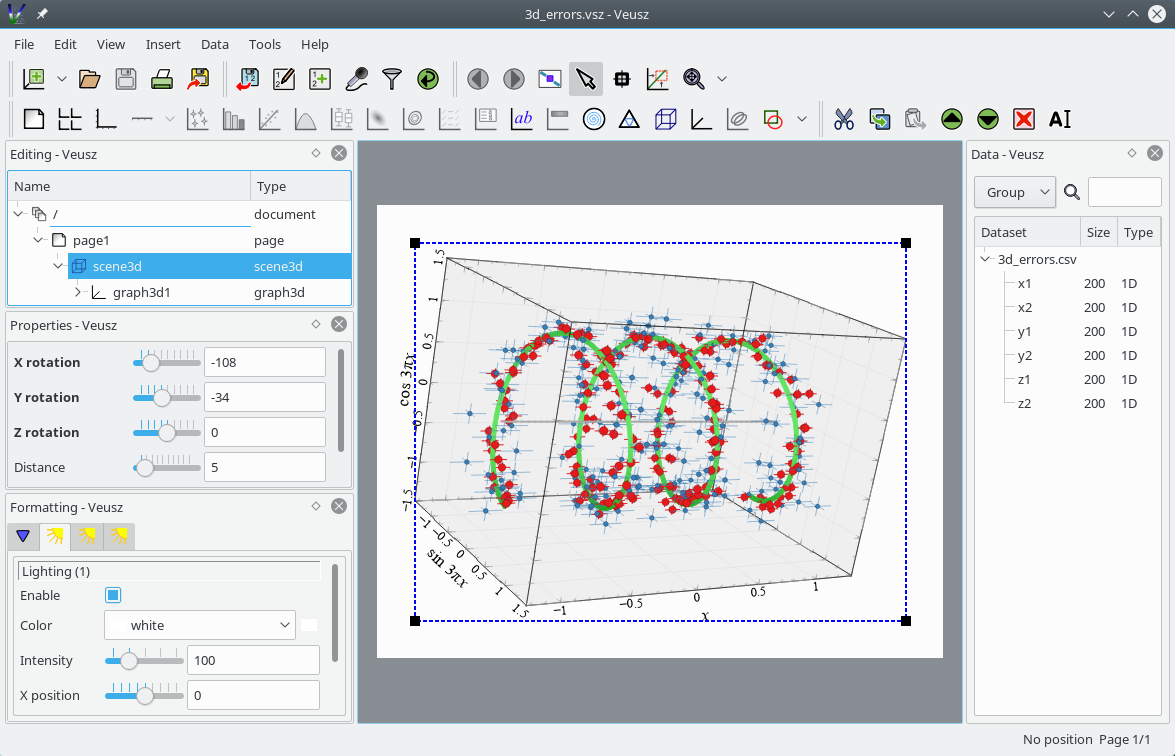
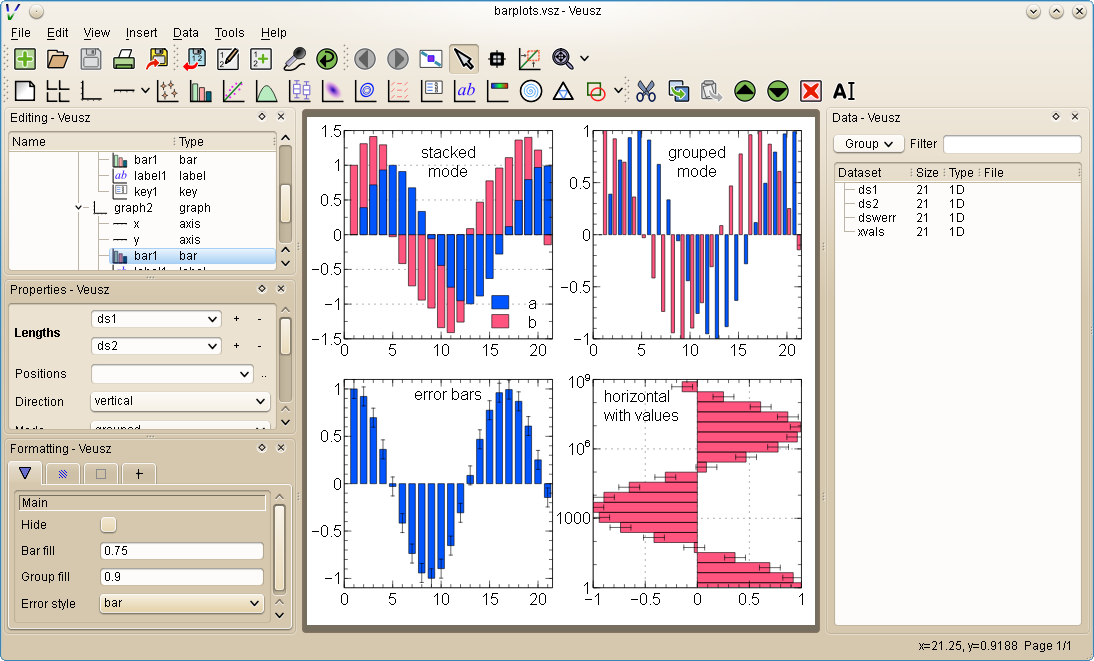
In Veusz plots are created by building up plotting widgets with a consistent object-based interface. Plotting types support by Veusz include the following: x-y, function, contour, image, stepped, date, vector field, box, polar, ternary, nested and stacked. Plots can also include multiple axes.
Screenshots
Observed history
| App | Change | Version | When ↑ |
|---|
No observed changes yet.
The initial import establishes a baseline. Future version changes will appear here.
Browse the app catalogue →Upstream releases
Release notes supplied by the developer. These dates are not Flathub package publication times.
4.2.14 Apr 2026
No release notes supplied.
4.225 Oct 2025
No release notes supplied.
4.113 Jun 2025
No release notes supplied.
4.01 Jun 2025
No release notes supplied.