KCachegrind is a profile data visualization tool, used to determine the most time consuming parts in the execution of a program.
Features:
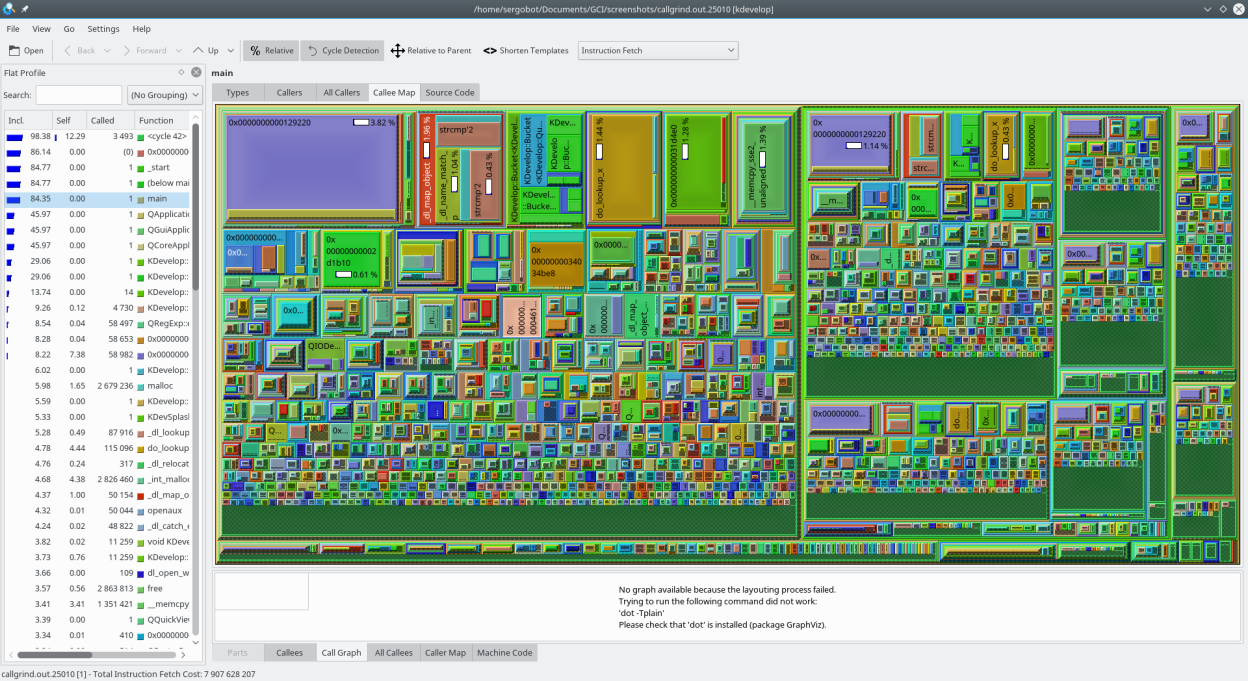
- KCachegrind visualizes profiles (i.e. runtime characteristics) of applications in various ways, including call graph visualisations and source/disassembler annotation.
- It can load profiles generated by the cache simulation/call tracer Calltree, a Valgrind tool. Thus, profiling does not need any preparation, can cope with shared libraries and plugin architectures, and does not influence the measuring itself.
- Converter scripts for OProfile, Perl, and PHP.
- Switching between multiple visualization layouts.
- Call graph can be exported as image (PNG).
- Simultaneous display of 2 event types in Call and Annotation View
Screenshots
Observed history
| App | Change | Version | When ↓ |
|---|
No observed changes yet.
The initial import establishes a baseline. Future version changes will appear here.
Browse the app catalogue →Upstream releases
Release notes supplied by the developer. These dates are not Flathub package publication times.
26.04.32 Jul 2026
No release notes supplied.
26.04.24 Jun 2026
No release notes supplied.
26.04.17 May 2026
No release notes supplied.
26.04.016 Apr 2026
No release notes supplied.