
Simple serial plotter
Features:
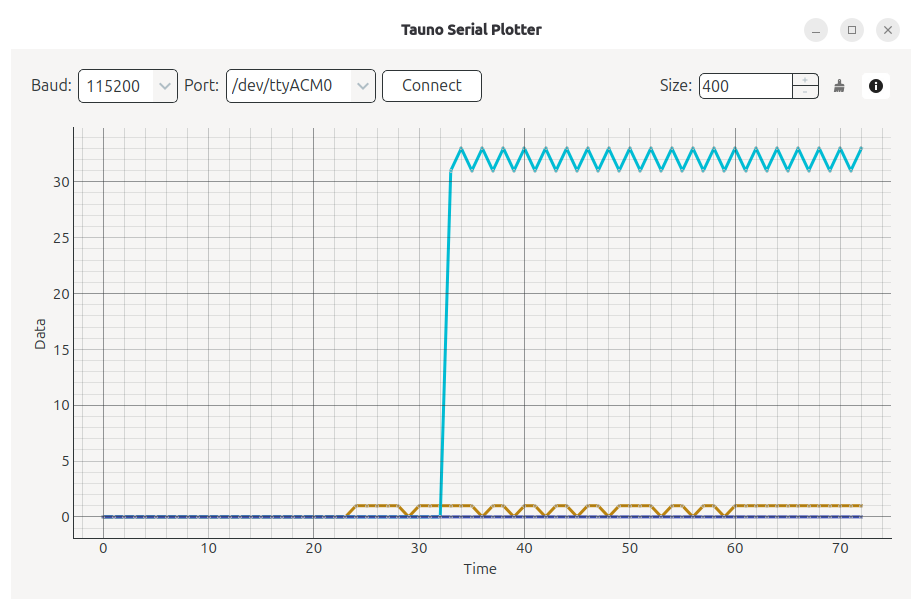
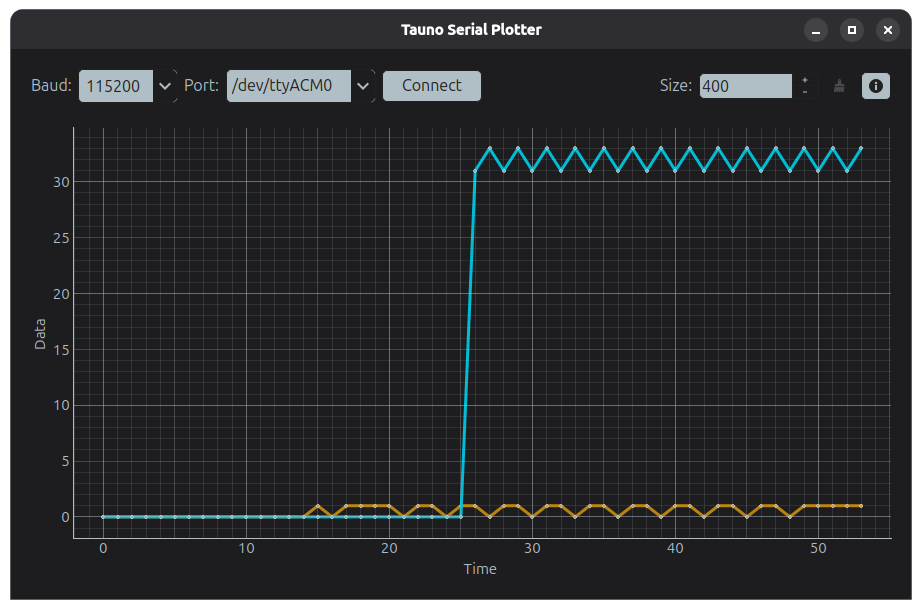
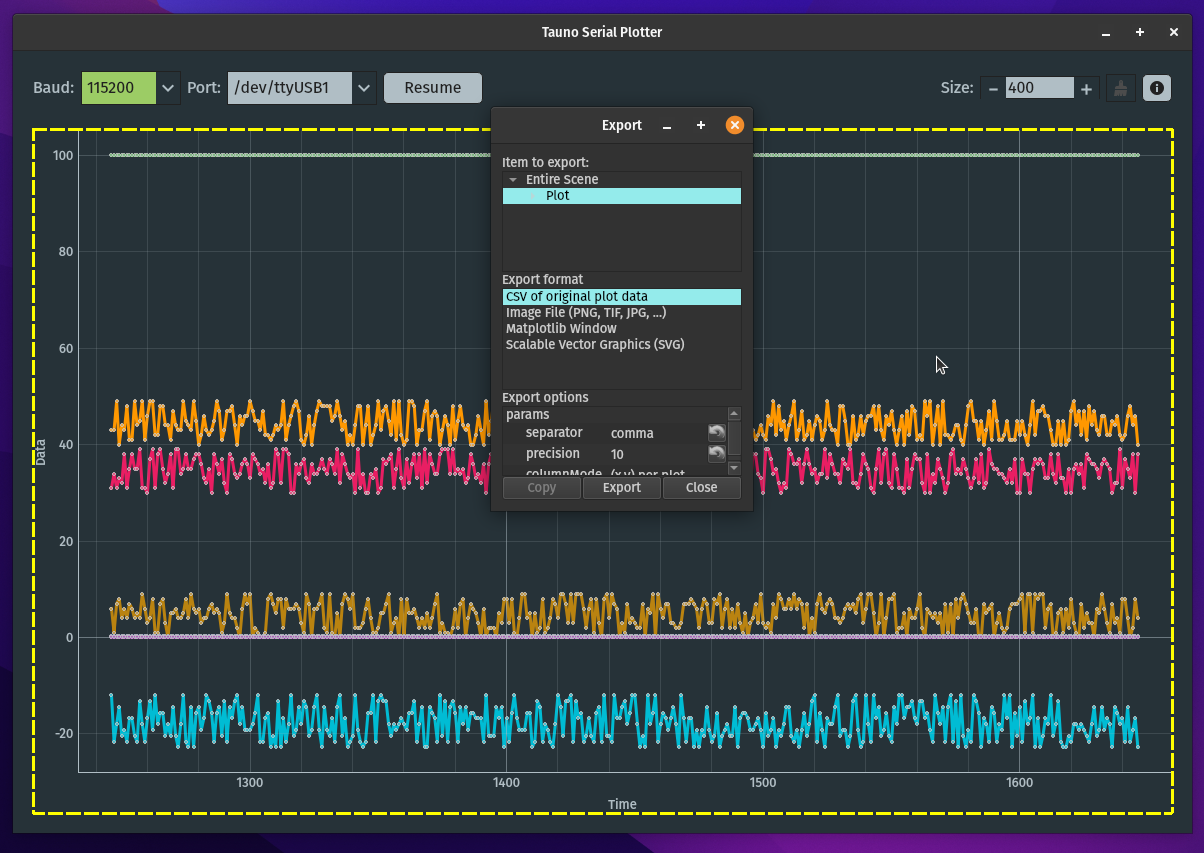
- Plotting of multiple variables, with different colors for each
- Can plot both integers and floats
- Can plot negative values
- Auto-scrolls the Time scale (X axis)
- Auto-resizes the Data scale (Y axis)
Incoming serial data should be string. Ending with new line character. Numbers (int and float) can be separated with almost any character. Like: "label2la15be17el28/31/42/54 78\n" or "a2b1.5c1.7d2.8/3.1/4.2/5.4 7.8\n". But not with - unless it is a negative number: "-10\"
Screenshots
Observed history
| App | Change | Version | When ↓ |
|---|---|---|---|
| updated | 1.21.8 | 8 Oct 2026 |
Upstream releases
Release notes supplied by the developer. These dates are not Flathub package publication times.
1.21.88 Oct 2026
Added data sidebar.
1.21.77 Oct 2026
Added selectable bar graphs that display the latest value for each label.
1.21.515 Sept 2026
Added automated tests for application behavior and packaging.
1.21.413 Sept 2026
Improved application state management and theme naming.