
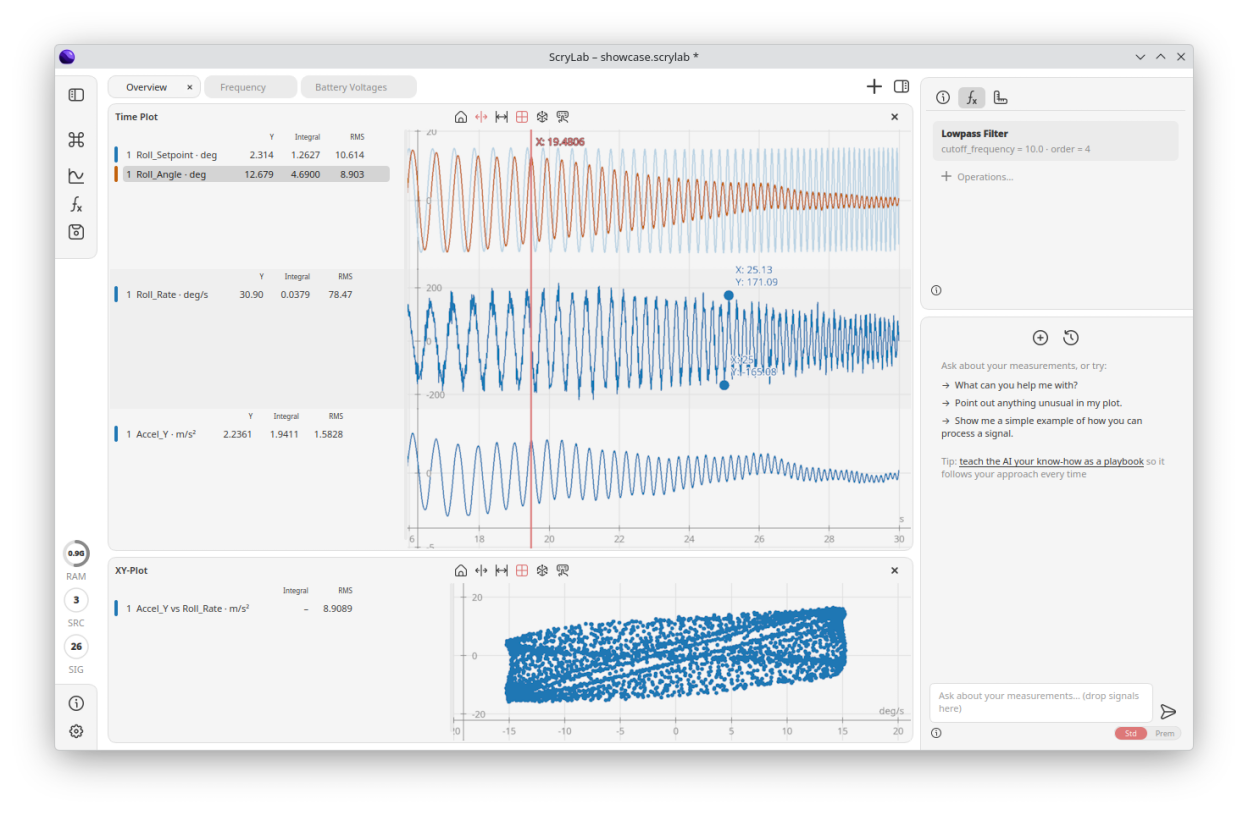
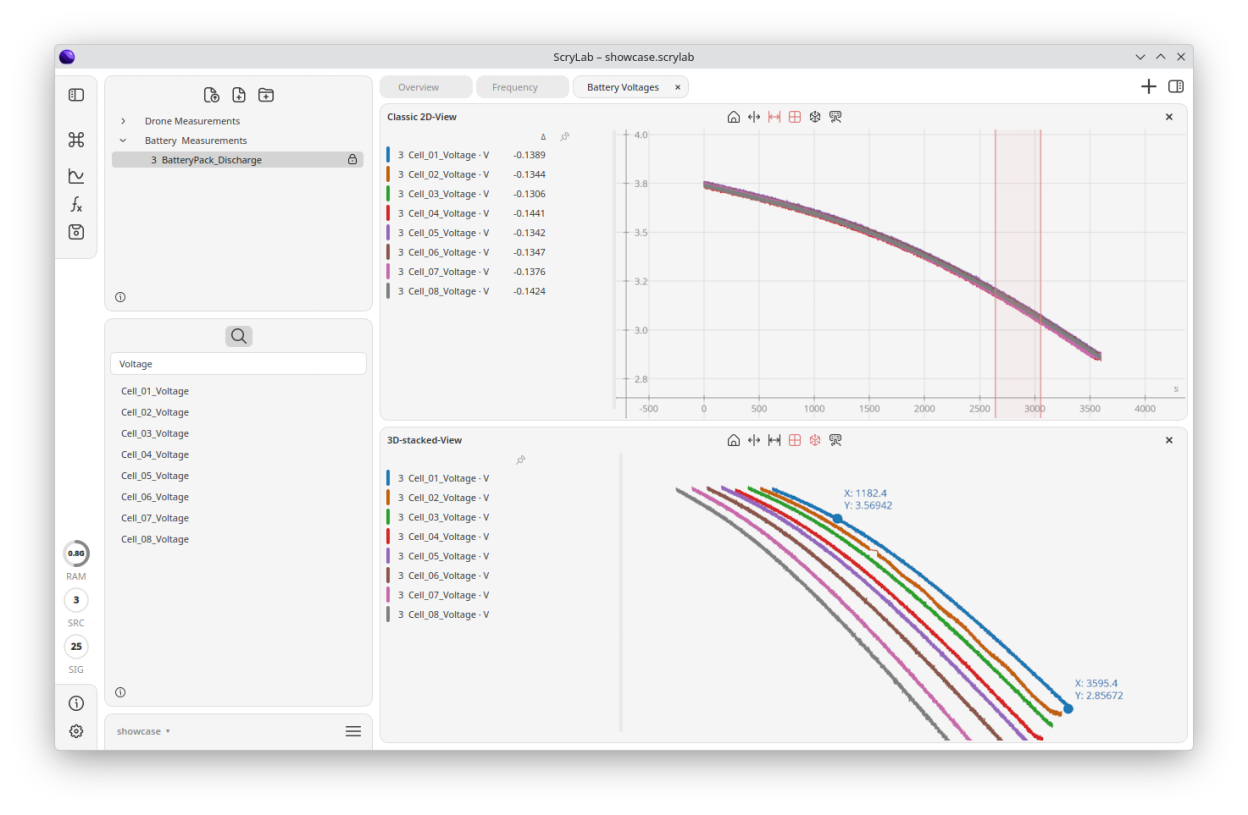
With ScryLab, data from a running Python environment or from measurement files can be explored in interactive plots for side-by-side comparison and analysis.
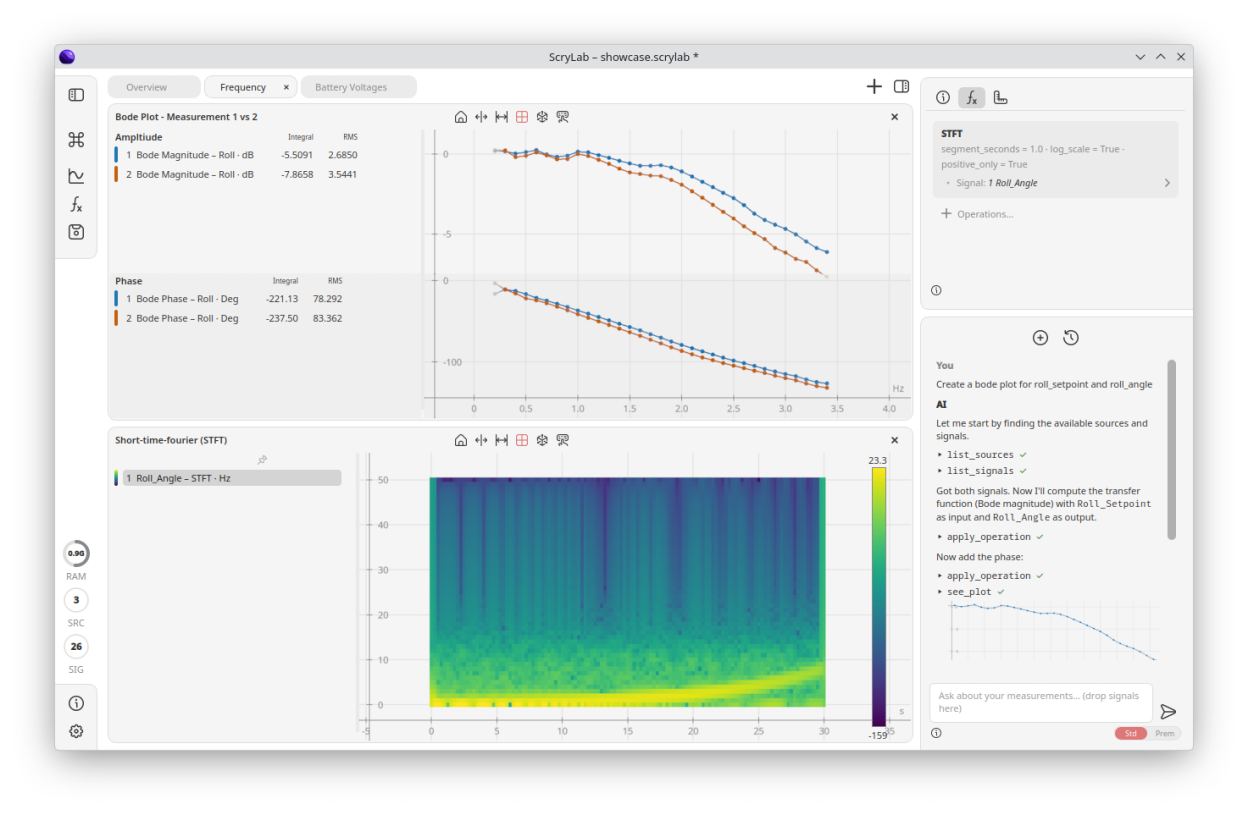
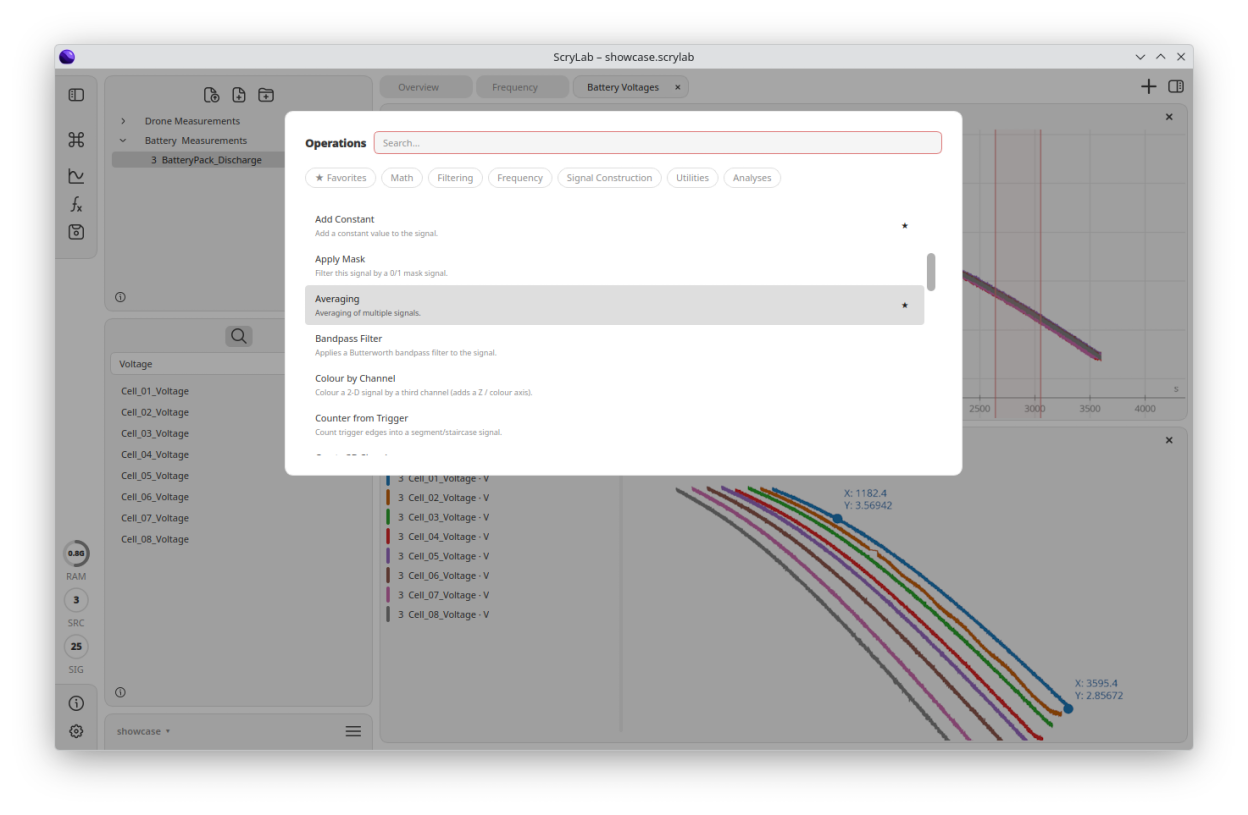
It includes line, scatter, XY, frequency and spectrogram views, plus tools from simple operations like addition, derivative and integral to advanced analysis such as FFT and STFT, including moving averages and regression.
Imports CSV and Excel tables with a guided import that detects time columns, plus MDF measurement files (.mf4, .mf3, .dat). HDF5 is ScryLab's own storage format; HDF5 files from other tools load as long as they contain plain 1-D signal datasets. A local REST API accepts signals from any programming environment or toolchain.
Includes an optional AI assistant that can operate ScryLab. It comes with a free trial; further usage requires purchasing credits on the website or bringing your own API key / connecting via MCP.
Screenshots
Observed history
| App | Change | Version | When ↓ |
|---|---|---|---|
| updated | 0.4.1 | 13 Oct 2026 |
Upstream releases
Release notes supplied by the developer. These dates are not Flathub package publication times.
0.4.113 Oct 2026
- Fixed: Replacing a data source
0.4.012 Oct 2026
- Logarithmic axes and a lockable aspect ratio (right-click an axis).
- Draw a signal as line, scatter, step or stem (right-click → Display).
- Choose which plots share cursor and range via the icon in the plot´s title bar.
- Select signals across rows with Ctrl/Shift-click.
- New operations and analyses, e.g. Campbell Diagram, Nyquist Plot, Smooth Trend (LOWESS) and Binned Average.
- Empty rows now close automatically.
- "Windowed Linear Regression" is deprecated – use "Smooth Trend (LOWESS)" or "Binned Average" instead.
- Faster plot rendering, an improved AI assistant, and various bug and crash fixes
0.3.15 Oct 2026
- Fixed a crash on the second right-drag zoom.
- Fixed the busy overlay not showing up.
0.3.05 Oct 2026
- Press Y to fit the y-axis of every row to the data in the visible x range (the x-axis stays as it is).
- New "MDF Time Axis" setting (Settings → Signals): load MDF files in "Seconds from start" (default) or "Date/time".
- New operation "Align Start to Zero": start the x-axis at 0 s so recordings made at different times overlay. Works on signals and whole data sources.
- Time-stamped signals from different measurements are now combined by their real date and time, and a data source has one common time reference so cropping or shifting cuts the same window on every channel.
- The mouse wheel no longer changes dropdowns or number fields – it scrolls the dialog or panel instead, so values aren't changed by accident.
- AI: on plots with a date axis the AI reads and sets cursor, range and view as dates/times, and can measure signals of several measurements over one time range.
- Fixed: cancelling a load now stops right away, saving an .h5 source keeps the time base of XY signals, and a crash on Windows shortly after closing a plot or first using the AI chat.
- Measurement files on a network drive now load faster and with progress information.